
NOVEMBER 2026
ProcessVue Launches ProcessVue ARC to Bring Standards-Based Alarm Performance Analysis to Every Site
ProcessVue has launched ProcessVue ARC, a web-based alarm performance analysis tool that turns historical alarm data into KPI dashboards and reports aligned with ISA-18.2, IEC 62682 and EEMUA 191.
Closing the Gap Between Alarm Data and Alarm Insight
Most sites already hold the data they need to understand their alarm performance. It sits in the alarm historian, and it can be exported at any time. The difficult part is turning it into reliable KPIs.
Teams that attempt this in spreadsheets or BI tools first have to work out how to calculate each measure correctly (alarm floods, chattering, standing alarms, operator response times), then build and maintain the logic to produce them. Large exports quickly exceed what a spreadsheet can handle, and results vary from one analyst to the next. As a result, alarm performance reviews are often delayed, inconsistent, or not carried out at all.
ProcessVue ARC removes that barrier. The KPI engine is already built, so the analysis can start as soon as the data is uploaded.
From Historian Export to KPI Dashboard
UPLOAD
MAP
Match the export’s columns (timestamp, tag, alarm state, priority) to ARC’s standard format once, and save the mapping as a template for future studies.
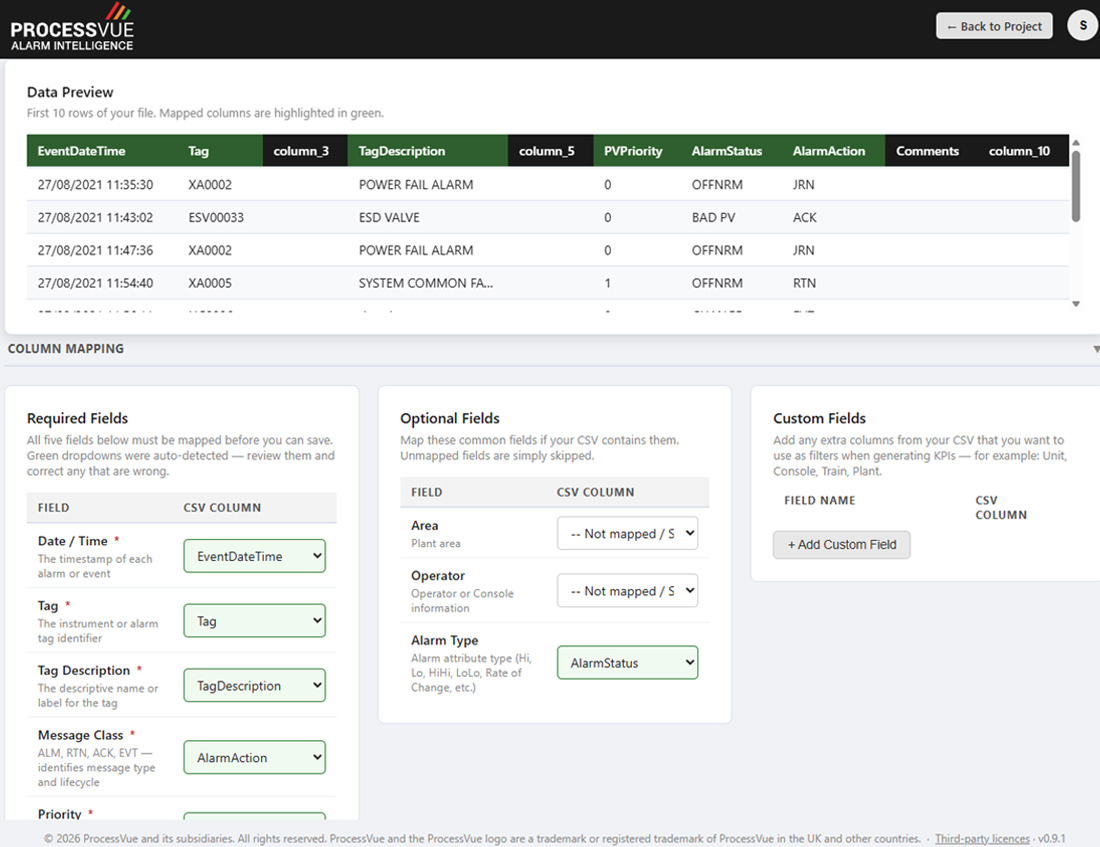
Figure 1 – Column mapping in ProcessVue ARC: required fields are auto-detected from the CSV export and highlighted in green, with a live preview of the data.
- Alarm rates against manageable and overloaded benchmarks
- Alarm flood detection, including first-up alarms
- Bad actor and Top 10 alarm identification
- Chattering, fleeting and standing alarms
- Shelved and suppressed alarms
- Operator response times
- Pattern recognition and alarm activity heat maps
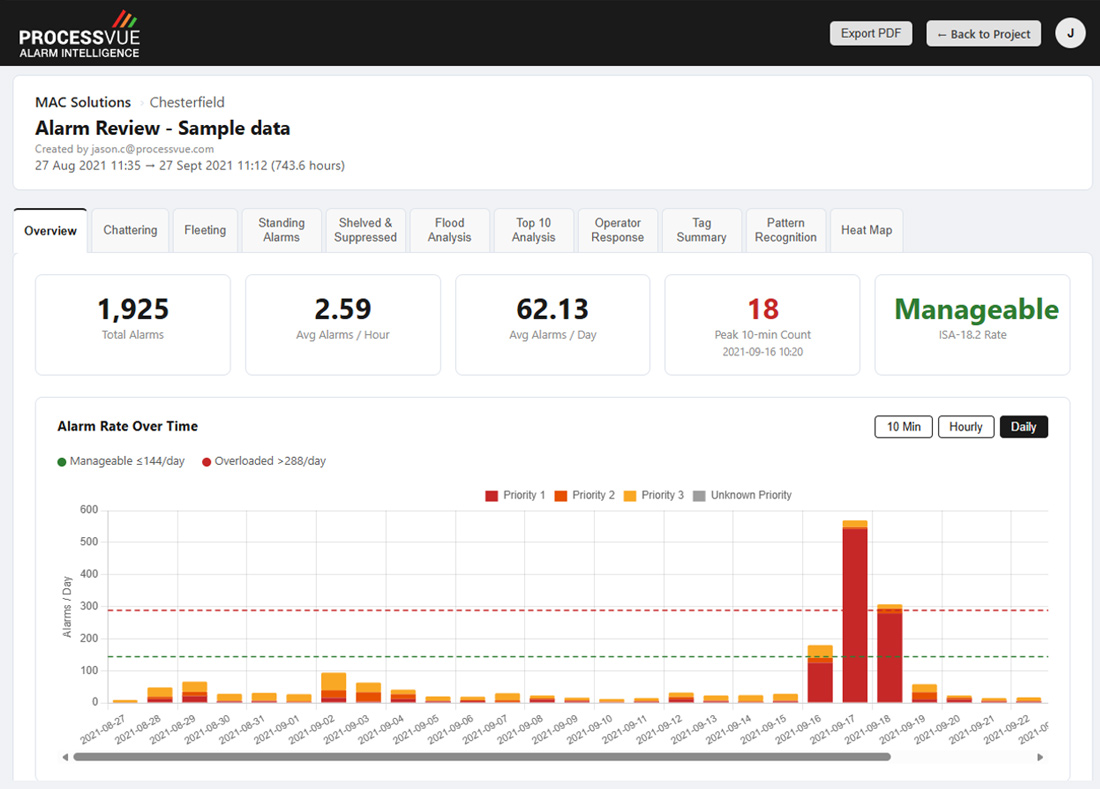
Figure 2 – The ARC Overview dashboard: headline KPIs and alarm rate over time, measured against manageable and overloaded benchmarks.
Practical Use Cases
ARC is designed for periodic, defined pieces of work, such as:
- Monthly or quarterly alarm performance reviews that show a site's position against industry standards
- Benchmarking before an alarm rationalisation project, to establish a baseline and identify where to focus effort
- Alarm audits by engineering consultancies, with each client's sites and studies kept separate under one account
- Turnaround, commissioning and handover reviews, where a permanent system isn't practical
Built for Industrial Environments
- No connection to plant systems: ARC works only with exported files. It never connects to, or writes to, a control system.
- Nothing to install: ARC is cloud based, so there's no on-site deployment or IT project.
- Works with existing systems: any system that can export alarm data to CSV is supported, and Valmet exports are recognised automatically.
- Secure by design: MagicLink passwordless sign-in, and a documented security assessment programme aligned with the EU Cyber Resilience Act.

Part of the ProcessVue Alarm Management Platform
ARC and ProcessVue Analyser answer different questions. ARC is retrospective. It analyses a defined dataset and answers “what happened during this period?” ProcessVue Analyser provides continuous alarm management, connected to live operational data, and answers “how are we performing, and what needs attention right now?”
For many teams, ARC is a natural starting point. An ARC study measures alarm system performance, shows whether there is a problem, and shows how big it is. These findings often build the case for continuous alarm management.
“In my 20 years in alarm management, I’ve lost count of the sites I’ve visited that were trying to measure alarm performance by hand in Excel. Doing it properly means knowing how to calculate every KPI and checking the results for errors. ARC frees up that time, so teams can focus on improving their alarm system instead of measuring it.”
Jason Cook
ARC Product Manager, ProcessVue