Views
Alarm Intelligence in Action: Investigating an Alarm Flood
See how ProcessVue brings alarm data, context, and AI together to investigate an alarm flood, understand what happened, and identify opportunities for improvement.
JAMES FOX
SEPTEMBER 2026
Alarm floods are among the most visible and disruptive symptoms of a troubled alarm system. During a flood, operators may receive more alarms than they can reasonably interpret and act upon. Important warnings can become buried beneath consequential, repeating or nuisance alarms, reducing situational awareness precisely when it matters most.

Detecting a flood is only the beginning. Improvement depends on understanding what initiated it, how it developed and which alarms helped or hindered the operator.
A recent request from a consultancy specializing in industrial automation and human factors gave us an opportunity to demonstrate how Alarm Intelligence can answer these questions in a faster and more dynamic way.
Starting the Alarm Flood Analysis
The request was to create an alarm flood analysis dashboard. Instead of beginning with a predetermined collection of charts, we started with practical investigation questions:
- When did the flood occur, and how long did it last?
- Where was the activity concentrated, and which equipment was involved?
- Which alarm appeared first, and what followed?
- Which alarm appeared first, and what followed?
- Which alarms were useful, consequential or simply adding noise?
- Was appropriate operator-response information available?
- What improvement actions should follow?
The request was to create an alarm flood analysis dashboard. Instead of beginning with a predetermined collection of charts, we started with practical investigation questions:
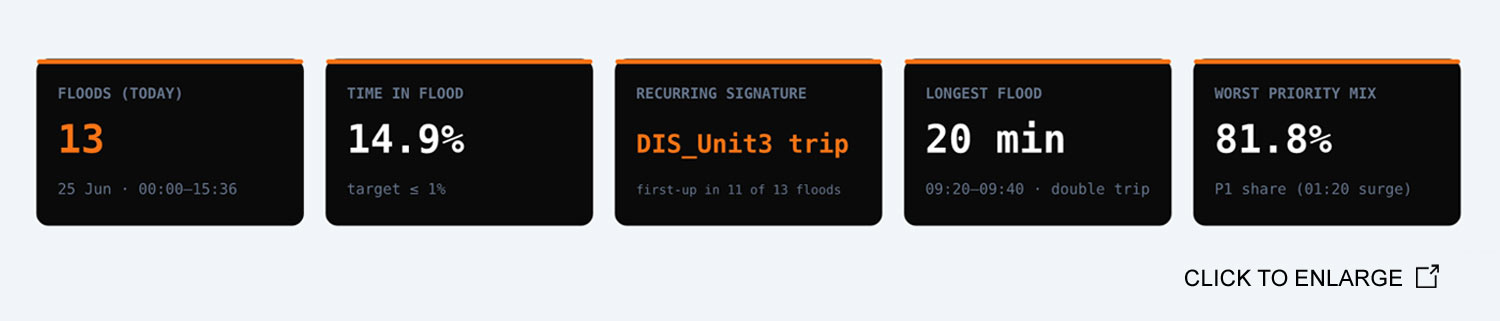
Figure 1. The overview compares identified flood periods by duration and scale, establishing the wider pattern before an individual event is investigated.
Finding Patterns Behind Alarm Floods
A conventional flood report may show that an alarm-rate threshold was exceeded during a particular period. That is useful, but it does not explain why the flood occurred or how the alarm system behaved as the process condition developed.
That finding changed the investigation. Instead of treating the floods as unrelated bursts of activity, attention could focus on a repeatable operational scenario.
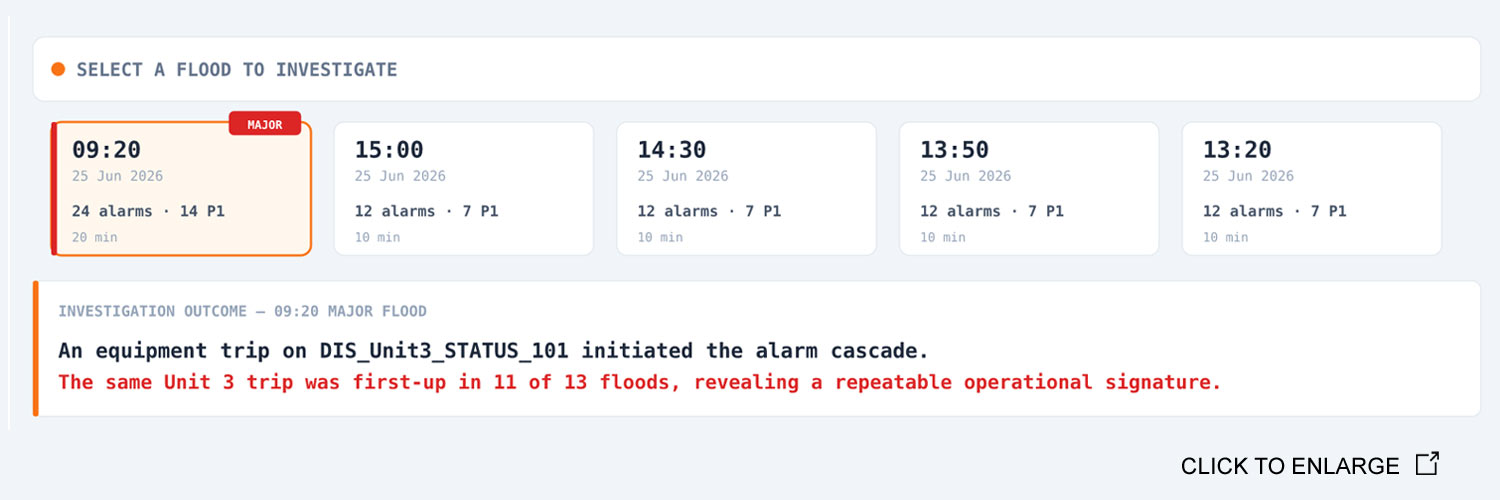
Figure 2. Comparing multiple floods reveals a recurring initiating event, allowing investigators to distinguish repeatable behavior from isolated incidents.
Analyzing What Challenged the Operator During the Alarm Flood
Alarm count alone does not show where the activity occurred, which equipment contributed to it or what mix of priorities was presented to the operator.
The dashboard brought together the affected plant areas, equipment involvement and priority distribution. A flood spread across several areas can present a different challenge from one concentrated around a single equipment train. Equally, a large number of lower-priority consequential alarms can obscure the smaller number of alarms essential to understanding and responding to the initiating event.
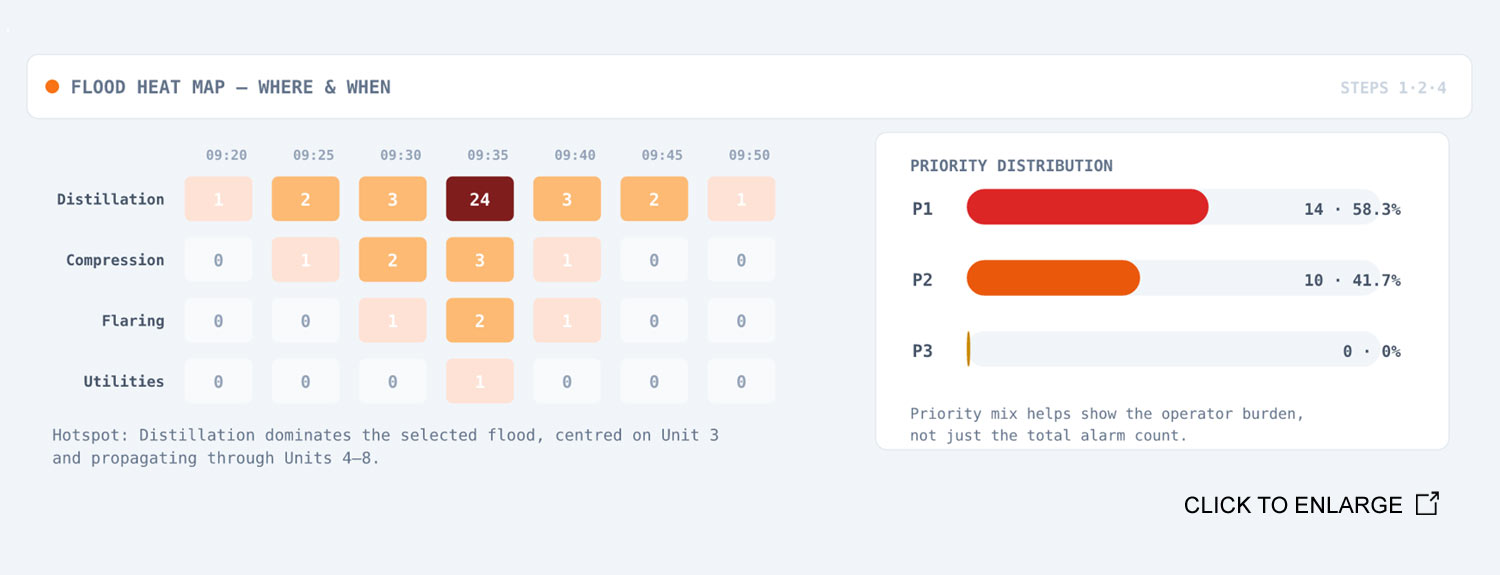
Figure 3. Area and priority views show where the flood was concentrated and the mix of alarm information presented to the operator.
Reconstructing the Alarm Flood beneath the noise
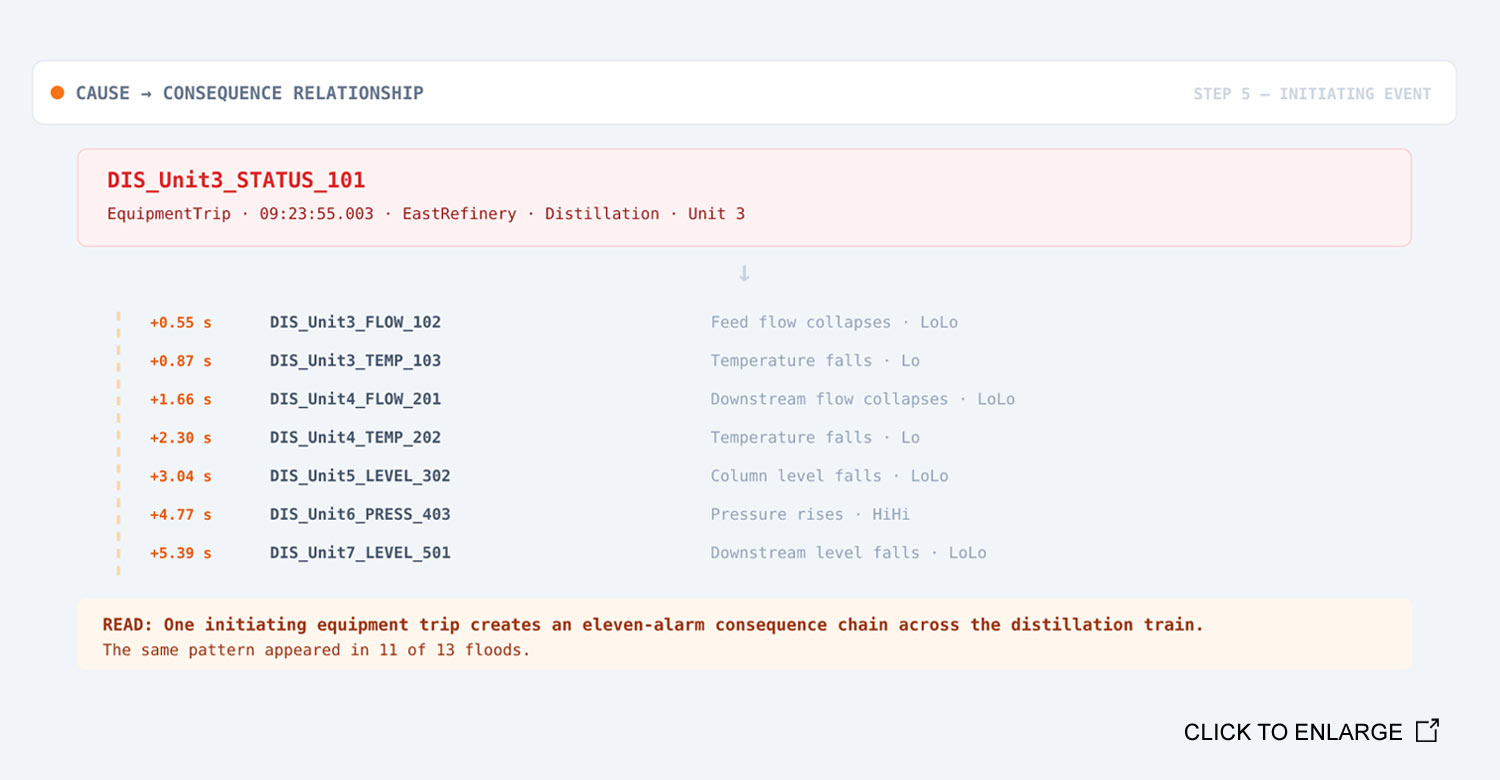
Figure 4. The cause-to-consequence view connects the potential initiating event with the downstream alarm cascade, revealing the operational event beneath the alarm volume.
The cause-to-consequence view connected the potential Unit 3 initiating event with the downstream cascade. It distinguished the underlying event from the alarm volume, helping prevent improvement work from focusing on the loudest symptoms rather than the initiating condition.
Reconstructing how the event propagated allows teams to consider whether the initiating alarm provided sufficiently early and clear warning, whether consequential alarms added meaningful information, and whether alarm delays, deadbands, state-based alarming or operator guidance should be reviewed.
Connecting Alarm Management Data with the ProcessVue Alarm and Event Data Fabric
The dashboard could be assembled quickly because the ProcessVue Alarm and Event Data Fabric already connected the information required for the investigation:
- ProcessVue Sequence: Collects, conditions and contextualizes alarm and event data.
- ProcessVue Analyser: Identifies floods, nuisance behavior, performance trends and recurring patterns.
- ProcessVue Guardian: Preserves alarm configuration, rationalization decisions, engineering knowledge and operator-response information.
- ProcessVue AI Gateway: Provides governed access to this information for AI-assisted investigation.
The dashboard was created in minutes, but the intelligence behind it was built over years.
That speed came from established domain knowledge and trusted, structured alarm information, a foundation an uncontrolled alarm export would not provide.
From Alarm Flood Analysis to Alarm Management Improvement
The investigation also considered whether the alarms involved contained the engineering knowledge needed to support the operator. Information available through Guardian revealed where Alarm Response Manual content was incomplete or unavailable. This raised questions about whether the alarm purpose, potential causes, consequences, response time and required operator action had been properly documented and approved.
The dashboard translated the findings into potential actions, including completing missing Alarm Response Manual information, rationalising initiating and consequential alarms, investigating repeating behavior, reviewing alarm configuration, assessing state-based suppression and investigating the recurring Unit 3 trip.
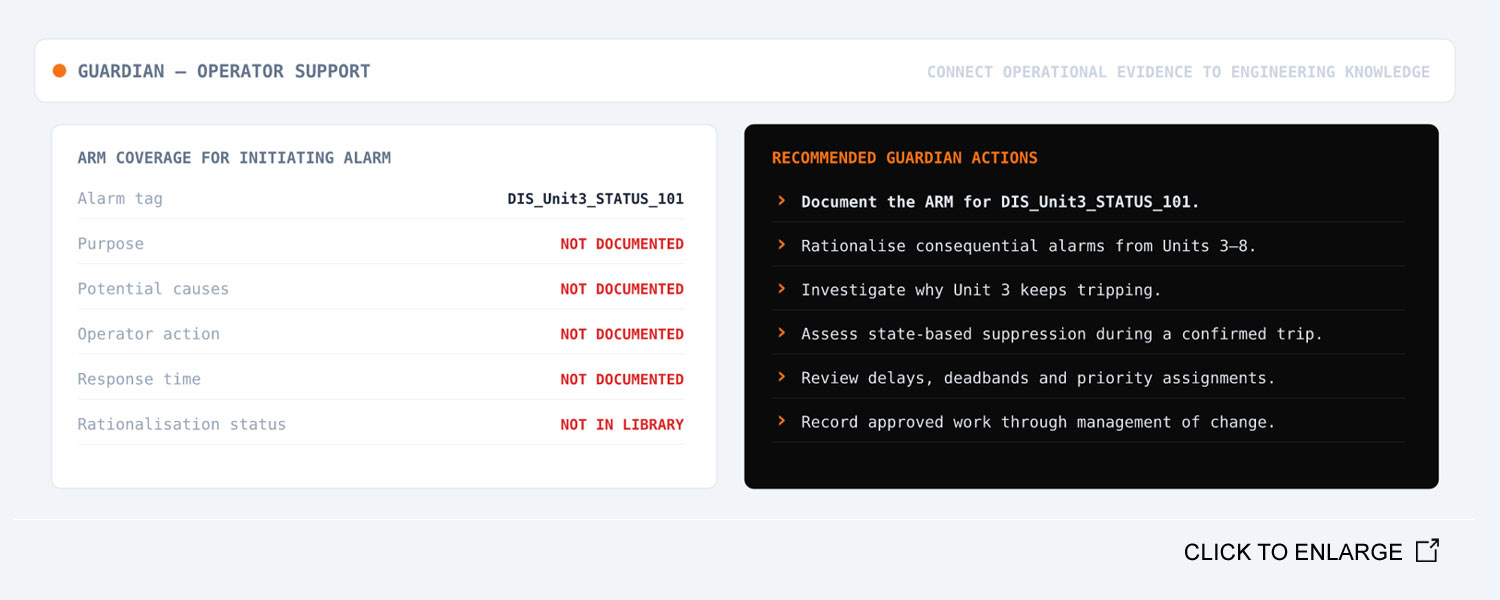
Figure 5. The investigation concludes with structured improvement actions, connecting operational evidence with documentation, rationalization and management of change.
These are proposed actions, not automatically approved changes. Each requires appropriate process, control-system and alarm management review, preserving engineering judgment while reducing the time needed to focus attention.
An Interface Shaped by Alarm Flood Investigation
A dashboard intended for repeatable operational use still requires appropriate development, testing and validation.
For exploration, the ProcessVue AI Gateway allows the interface to develop around an operational question as the evidence is examined, rather than forcing the investigation into a predefined dashboard.
Useful approaches can then be validated and developed into repeatable reports or future product capabilities.
Alarm Intelligence in Action for Industrial Alarm Management
This is Alarm Intelligence in practice: Claude helped shape the visual interface, while the ProcessVue AI Gateway provided governed access to the connected evidence behind the investigation.
The value was not simply the speed of creating the dashboard. It was the ability to move from a practical question to a focused investigation while retaining a clear connection to the evidence.
What happened, where did it happen, what challenged the operator and what should be improved?

Alarm Flood Analysis: Frequently Asked Questions
Alarm management standards and guidance, including ISA-18.2, IEC 62682 and EEMUA 191, use regular 10-minute intervals to identify an alarm flood:
- Flood starts: > 10 alarms in 10 minutes.
- Flood continues: across one or more 10-minute intervals.
- Flood ends: < 5 alarms in a subsequent 10-minute interval.
The aim is to keep floods short, limit the total number of alarms presented and remain in flood for less than approximately 1% of the reporting period.
Effective investigation should then look beyond the alarm count to understand what initiated the flood, how it developed and what challenged the operator.
It connects alarm performance, event sequence, plant context and engineering knowledge to explain what happened, what mattered and what should be investigated next.
The dashboard was created conversationally using Claude and the ProcessVue AI Gateway. ProcessVue had already collected, conditioned, contextualised and structured the alarm information, allowing AI to assemble and present trusted evidence without replacing the data foundation or the domain knowledge guiding the investigation.
No. AI can help identify sequences, recurring signatures and potential relationships, but these remain hypotheses until validated by people with appropriate process and engineering knowledge. Root-cause analysis may also require process trends, equipment history, control-system information, operating procedures and discussions with operators.
It connects alarm and event data with performance evidence, process context, alarm configuration, engineering knowledge and operator-response guidance. Sequence, Analyser and Guardian contribute different facets, while the ProcessVue AI Gateway provides governed access for AI-assisted investigation.
Talk to an Expert
See how ProcessVue can improve your alarm management strategy.